Summary
Synthetic Controls can quantify the impact of a project, policy, initiative or event. It estimates the outcome data without the impact of the project (policy, initiative or event) using a machine learning algorithm to select the optimal combination of controls from a wider control group.
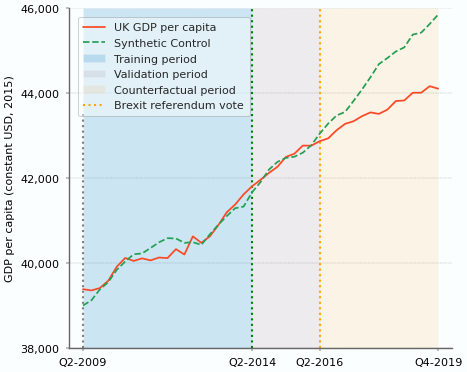
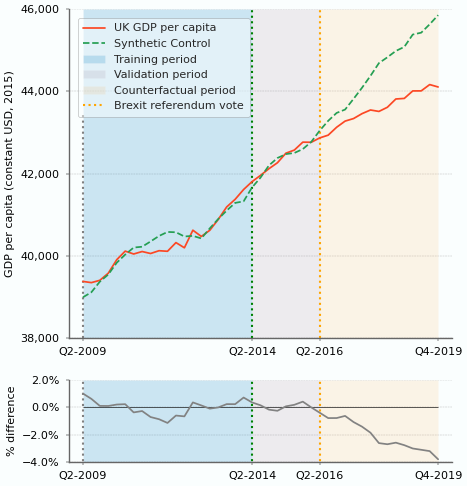
We have applied Synthetic Controls to UK economic output (GDP per capita) using data from other OECD countries to estimate the impact of Brexit on the UK economy. The Brexit referendum was held in Q2-2016. The model is trained on data from Q2-2009 to Q2-2014. Data from Q2-2014 to Q2-2016 is used to evaluate how well the Synthetic Control predicts UK output before the Brexit referendum. The Synthetic Control then estimates UK output without the impact of Brexit from Q2-2016 to Q4-2019. Our Synthetic Control combines GDP data for the United States, Israel, Spain and Portugal.
Our results indicate that UK economic output was 3.8% lower by Q4-2019 due to Brexit. This is equivalent to around GBP 94 billion or around 6x the UK’s net contribution to the EU budget in 2019.

The most important data is the data you don't have
Abraham Wald, Mathematician
Technical Glossary
Treatment
the project, policy, initiative, or event that is the focus of the impact analysis
Unit
a single, defined element that we can observe and measure, e.g. a person, facility, company, region, country
Target
the unit that is impacted by the Treatment and which is, therefore, the unit of interest for the analysis; the ‘treated unit’
Controls
units that are not impacted by the Treatment but are similar, in important ways, to the Target. These serve as viable candidates to estimate the counterfactual outcome
Outcome
the variable of interest for the analysis, e.g. a consumer decision, production output metric, financial metric (revenue, cost, gross margin), GDP per capita
Features
other variables that partly explain/ determine the outcome, also called explanatory variables, e.g. product prices, substitute goods/services, capital employed, etc.
Pre-treatment period
the time period before the treatment affected the Target, i.e. the period before the start of the project
Post-treatment period
The time period following the treatment was applied to the Target, i.e. the period in which the counterfactual outcome is estimated
Chart 1: Distributions of the Controls' Feature values
Source: OECD
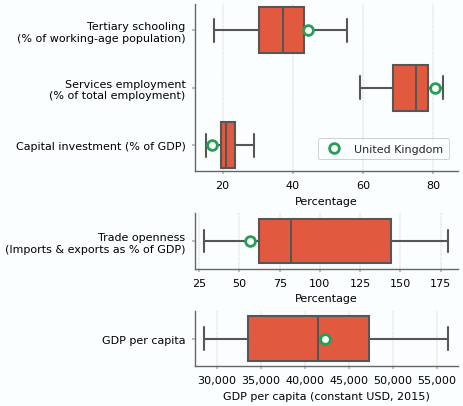
Chart 2: Individual Controls and Naïve Aggregates are Poor Comparators of the UK
Source: OECD
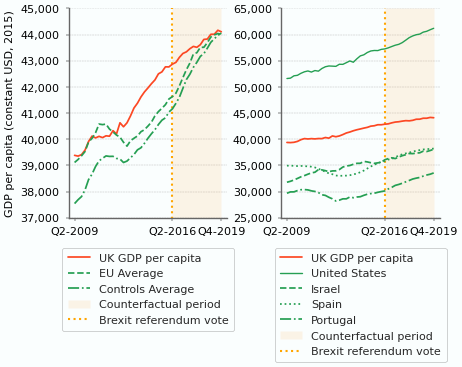
Table 1: Feature Values for the UK and Selected Controls and Aggregates
Source: OECD

Chart 3: the Synthetic Control Matches Closely UK GDP Per Capita in the Training and Validation Periods
Source: OECD and the analysis of North Economics
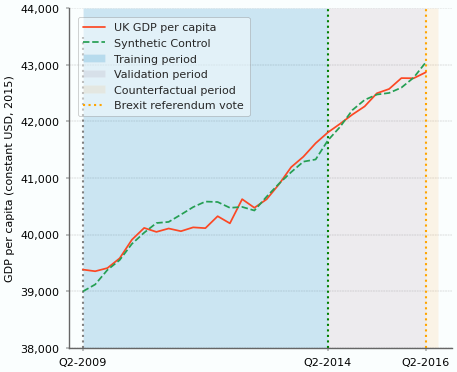
Table 2: the Synthetic Control produces Feature Values Close Similar to the Actual UK Values
Source: OECD and the analysis of North Economics

Chart 4: the Synthetic Control Estimates UK output would have been materially higher following the Brexit Referendum with a Different Outcome
Source: OECD and the analysis of North Economics
The world is replete with data about the things we can observe. The modern, key decision maker in business and government expects a quantitative assessment of any new project, policy, initiative, or major event. Thorough quantitative analysis of a project can provide a smorgasbord of statistics on observed outcomes – averages, standard deviations, ranges, confidence intervals – but often the key question decision makers want answered is: what impact does the project have?

Impact is the difference between what did happened and what would have happened otherwise. The impact of a meteor strike is often clear: the crater in the earth reveals what happened and the land around it is usually a good indicator of what it would have looked like otherwise. The impact of a new drug (or vaccine!) is less immediately clear but a strong experimental design – where participants are randomly assigned to a treatment group or a control group – provide trial results that reveal the impact with a high degree of accuracy. In order to understand the impact of any new project, we need data on: what would have happened otherwise.
The most important data is the data you don't have
Abraham Wald, Mathematician
What would have happened otherwise is called the counterfactual scenario. The outcome of the counterfactual scenario is, by definition, unobservable. But it is possible to estimate outcomes in the counterfactual scenario. For example, the control group in a well-designed medical trial act as an excellent (statistically near-perfect) estimate of the counterfactual outcomes of the treatment group. In other situations, we can observe what happened before the new project and assume that those outcomes would have been unchanged in the counterfactual scenario or we can observe what happened for similar units that were not impacted by the new project and assume that the average outcome of those units would have been the counterfactual outcome out the treated group.
This article presents a quantitative method to analyse project impact in situations where only a small number of controls can be observed over time. The method is called Synthetic Controls. Synthetic Controls use machine learning algorithms to create a composite control using an optimal weighted average of multiple real controls. A successful synthetic control will fit significantly better than any individual control or simple average of multiple controls. We apply Synthetic Controls to UK economic output (GDP per capita) to estimate the impact of the Brexit referendum on the UK economy so far: we estimate a synthetic control for UK GDP per capita using data of other similar OECD countries and project it into the period after the Brexit referendum from Q2-2016 to Q4-2019.
Approaches to Project Impact Analysis
There are multiple approaches to project impact analysis (also referred to as causation analysis or causal inference). The situation often dictates which approach is most appropriate. The matrix below provides a simple schematic for which approaches are available in different situations based on whether:
- it is possible to control which units are treated, i.e. impacted by the project, and
- how many similar units there are to observe, or similarly the level of aggregation at which the project’s impact is felt.


Synthetic Control methods are best used where relatively few similar units are observable and where we need rely on observational data (where there is little experimental design control).
Synthetic Controls: an overview
Synthetic Control methods estimate a weighted average of a modest number of Controls to create a composite, synthetic Control. The Synthetic Control more closely mirrors important data about the Target in the pre-treatment period than any of the Controls individually. It uses machine learning algorithms to search for the optimal combination of the Controls that best replicates the values of the Target’s: (i) Outcome, and (ii) key Features in the pre-treatment period.
The pre-treatment period is split into a training dataset and a validation dataset. The Synthetic Control is estimated using the training dataset. Then it is assessed by observing the closeness of the Synthetic Control’s Outcome values to the Target’s Outcome values in the validation dataset.
Finally, the synthetic control is extrapolated into the post-treatment period to estimate the counterfactual Outcome of the Target and, thereby, the impact of the project on the Target.
The UK in a Brexit-less World: background and setup
The Brexit referendum asked a simple binary question: in or out. The outcome of the Brexit referendum held on June 23, 2016 (Q2-2016) fundamentally altered the economic conditions of the UK. The UK’s access to the EU single market was no longer guaranteed. It created significant uncertainty over the UK’s future terms of trade with its largest trading partner (the EU bloc), jeopardised a major thesis for foreign investment in the UK – tariff-free access to the entire EU single market, and exposed the intricate functioning of complex UK supply chains that often rely on finished and partly-finished goods transported across the English Channel. Such was the concern by major foreign investors, it was reported that the UK government may have provided financial guarantees to some soon afterwards.
Moreover, the UK’s future terms of trade with all other non-EU countries became a significant unknown as all trade agreements with non-EU countries are negotiated by the EU on behalf of the EU member states. Leaving the EU meant the UK was left without any bilateral trade agreements with other countries. It threw into doubt the long-term status of the 2.2 million EU nationals working in the UK, and the attractiveness of the UK for future working-age inward EU migration. Brexit was also an opportunity, according to its supporters, to foster improved, better-tailored trading terms for the UK with the rest of the world and to protect and encourage key domestic industries and markets.
More than five years have passed since the Brexit referendum was held. It is a natural question to ask: what has been the impact of the Brexit referendum on the UK economy? Or put differently: how would the UK economy have performed if the outcome of the Brexit referendum had been different? We can never know for sure, but Synthetic Controls can provide one way to make an estimate.
Data is available for more than three years (13 quarters) after the Brexit referendum and before the impact of the Covid pandemic in Q1-2020, and for seven years (28 quarters) before the Brexit referendum and after the downturn following the global financial crisis from Q2-2009.
GDP per capita is a straightforward Outcome variable to compare economic performance across multiple jurisdictions: we use GDP per capita in constant US Dollars (2015 prices) to compare directly across different countries and time periods.
The Controls are similarly economically developed national economies: we use other OECD countries with GDP per capita within 33% of the UK’s at the time of the Brexit referendum[1].
The Features must be explanatory variables of the Outcome. The Features chosen are adapted from the academic literature[2] and are average values calculated for the UK and the Controls around the date of the Brexit referendum. The Features are:
- past values of GDP per capita (which captures the time-persistence of GDP per capita)
- human capital development (the percentage of the working-age population with tertiary education)
- industry composition (the percentage of total employment in services industries)
- physical capital investment (gross fixed capital formation as a percentage of GDP)
- trade openness (the combined value of imports and exports as a percentage of GDP)
Chart 1: Distributions of the Controls' Feature values

Feature values vary across the Controls and the UK varies across the Controls’ Feature distributions (see Chart 1). The proportion of the working-age population with tertiary education – a measure of human capital – ranges from 17% to 55% across the Controls with the UK around the upper quartile level at 44%. The UK ranks towards the upper end of the Control distribution for the proportion of employees in services industries, but ranks near the lowest in capital investment and below the lower quartile level for trade openness.
Chart 2: Individual Controls and Naïve Aggregates are Poor Comparators of the UK

Table 1: Feature Values for the UK and Selected Controls and Aggregates

None of the controls, individually, are close comparators to the UK’s GDP per capita over the training and validation periods, or for the Features around the Brexit referendum average (see Chart 2 and Table 1). Similarly, neither are naïve aggregates such as a simple average of the Controls or the population-weighted EU average.
Chart 3: the Synthetic Control Matches Closely UK GDP Per Capita in the Training and Validation Periods

Table 2: the Synthetic Control produces Feature Values Close Similar to the Actual UK Values

The UK in a Brexit-less World: a Synthetic Control estimate of an alternate UK
The Synthetic Control, however, produces a significantly better fit to the UK’s feature values and GDP per capita across the training period (see Chart 3 and Table 2).
Moreover, the Synthetic Control provides a good fit over the validation period before the Brexit referendum: the Synthetic Control is estimated over the feature values and the UK GDP per capita in the training period only, so the Synthetic Control is projected into the validation period as a way to evaluate the predictive accuracy of the Synthetic Control outside of the training dataset (and before the post-treatment period where we expect some deviation from the actual data to occur). The fit in the validation period indicates that the Synthetic Control provides good predictive accuracy.
The Synthetic Control is an optimal weighted average of the Controls. More specifically, the Synthetic Control is a weighted average of just four of the Controls:
- Israel (weight = 0.45),
- United States (weight = 0.35),
- Spain (weight = 0.15), and
- Portugal (weight = 0.05).
The machine learning algorithm discarded most of the controls – 17 of 21 – to produce the optimal Synthetic Control. The Synthetic Control was also estimated with different sets of controls and produced similar results and weightings; for example, where Portugal (among others) is excluded from the control set then small proportions for the Netherlands and Sweden were used instead, an alternative Synthetic Control producing very similar results.
How Does the Synthetic Control Algorithm Work?
The machine learning algorithm seeks to minimise the difference between the Target data and the estimates generated using the Controls data by applying different weights. While this is a similar goal to multivariate linear regression models, the Synthetic Control algorithm is different to regression estimation in a number of important ways. First, the SC-algorithm seeks to optimise across two sets of inter-related weights simultaneously:
- control weights: the weights assigned to each of the controls as illustrated above, and
- feature weights: a cardinal ranking of the relative importance of each feature.
Second, the control weights are each constrained to be between 0 and 1, i.e. a proportion, and the sum of all the control weights must equal 1, i.e. to avoid scaling up or down of the aggregate of the controls data. Third, the Synthetic Control algorithm is optimising over two separate sets of data:
- a time series of the Outcome across a training period, and
- the feature values: often using averages taken around the start of the project or event.
The algorithm iterates over several steps: from a simple initial guess it measures the error rate, determines an update for each weight (direction and distance), updates the weight estimates, measures the error rate again, determines the next update, and so on. The algorithm is complete when the improvement in the error rate falls below a threshold value.
Chart 4: the Synthetic Control Estimates UK output would have been materially higher following the Brexit Referendum with a Different Outcome

The UK in a Brexit-less World: the counterfactual outcome and conclusions
Extrapolating the Synthetic Control into the post-treatment period following the Brexit referendum indicates that UK GDP per capita may have been significantly greater in the Counterfactual Scenario (see Chart 4). Moreover, this analysis suggests that the GDP per capita loss continued to increase as the UK’s withdrawal from the EU drew closer (in Q1-2020) and the resulting economic conditions of a post-Brexit UK became clearer.
By Q4-2019, the Synthetic Control analysis indicates an annual output loss per capita of USD 1,680 (in 2015 prices) or 3.8% following to the UK’s decision to withdraw from the EU. This translates to approximately GBP 94 billion in 2019 or over 6x the UK’s annual net contribution to the EU budget in the last year before its formal withdrawal (GBP 14.4. billion)[3].
Epilogue
Synthetic Control methods is a useful tool for economists, statisticians and data analysts to quantitatively assess the impact of a project, policy or event where the impact is felt at an aggregated level and where relatively few ‘good’ controls are available. Furthermore, Synthetic Controls enable the user to assess how the impact evolves over time, and with permutation methods it is possible to provide statistical significance around the counterfactual outcomes from the Synthetic Control.
This article presents Synthetic Control methods at the national level, but it can be directly applied to more typical business scenarios such as the impact of a new project or initiative in regional markets, major operating units and production facilities, or analysing an event on a company with a limited number of similar competitors.
Contact North Economics to discuss how Synthetic Controls or other quantitative methods for project impact analysis can be applied to your business needs.
Footnotes
[1]
[2]
[3]
The Controls used are: Austria, Australia, Bulgaria, Canada, Czechia, Denmark, Estonia, Finland, France, Germany, Israel, Italy, South Korea, Lithuania, Netherlands, Portugal, Slovakia, Slovenia, Spain, Sweden and the United States.
Abadie A. 2021. “Using Synthetic Controls: Feasibility, Data Requirements, and Methodological Aspects“, Journal of Economic Literature 59(2): 391-425.
Abadie A., Diamond A., Hainmueller J. 2015. “Comparative Politics and the Synthetic Control Method“. American Journal of Political Science 59(2): 495-510.
